Business Intelligence and Data Automation Services for Growth in Europe
We do not only offer reports. We offer the data architecture that ensures clarity, efficiency and security (Compliance) for your decision making. Our services are designed to solve the data challenge of your European business, from extraction (SQL) to visualization (Power BI).


Business Intelligence (BI) e Performance
Lack of visibility, decisions based on intuition, difficulty in measuring ROI.
Data Architecture & SQL Optimization
Slow processes, inconsistent data, high infrastructure cost.


Advanced SQL Consulting and ETL/ELT: Design and optimization of databases. Creation of automation pipelines for extraction, transformation and data loading, ensuring performance and reduction of operational costs.

Strategic Dashboards with Power BI: Development of interactive and mobile panels, focused on KPIs. We turn complex data into actionable insights for Finance, Sales and Operations.

Data Governance and Compliance
Risk of fines for GDPR, lack of security and data auditing.
Data Governance and Security: Implementation of access rules and auditing in the data ecosystem. We ensure that your reports and dashboards are fully compliant with strict European data regulations.
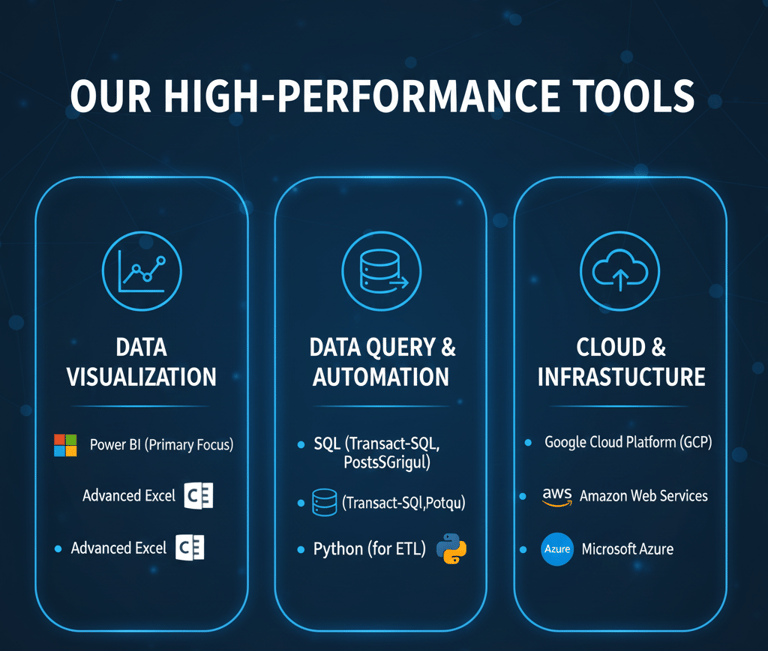
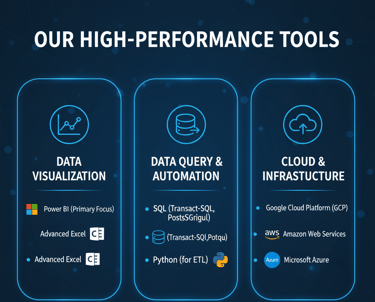
Our High Performance Tools
Data Visualization (Clarity and Decision):
Power BI (Core Focus): Advanced expertise in creating Strategic and Interactive Dashboards that transform complex data into actionable insights for executives and operations. We guarantee the visualization of critical KPIs with accuracy and speed.
Excel Advanced: Use of data modeling, Power Query and complex functions for fast analysis and smaller-scale Business Intelligence solutions, maintaining the flexibility and mastery of the tool most used by business areas.
Data Query & Automation (Foundation and Efficiency):
SQL (Transact-SQL, PostgreSQL): Deep knowledge in query optimization (Query Optimization), automation of ETL/ELT and data management. Our strong SQL foundation ensures the integrity, speed and organization of your data source.
Python (for ETL): Use of Python scripts for complex automation of data flows, cleaning, handling and movement of large volumes of information (ETL), promoting efficiency and scalability.
Cloud & Infrastructure (European scalability and security):
Google Cloud Platform (GCP) and Knowledge in AWS/Azure: Understanding data architectures in cloud environments. We are able to design and implement solutions that take advantage of the scalability, security and infrastructure of these platforms, essential for companies seeking performance and compliance (GDPR) in a European context.
Our approach is not limited to theory; it is underpinned by proven technical proficiency in the tools most demanded by the global and European market. We combine the power of the Cloud with the precision of Query and the clarity of Visualization to build robust, scalable solutions.
Don’t let your data be a liability. Turn it into your greatest competitive asset.
I want a Free Diagnosis of my BI Architecture.

Customer reviews
I am extremely satisfied with this product! It exceeded my expectations with its quality and performance. The customer service was excellent, and delivery was prompt. I highly recommend this to everyone.
Brian Moten
I am extremely satisfied with this product! It exceeded my expectations with its quality and performance. The customer service was excellent, and delivery was prompt. I highly recommend this to everyone.
Clarice Turner
★★★★★
★★★★★


Before Euro Data Solutions, the processing of our daily fleet reports took about 4 hours, overloading our SQL server and generating delayed decisions. The team implemented a surgical optimization in our SQL queries and automated the ETL pipeline. The result was immediate: 75% reduction in processing time. Data now reaches Power BI in minutes, not hours. For us, this translates into real savings in infrastructure costs and a much more efficient logistics.
- Delta Logistik GmbH (Germany, Transport Sector) Klaus Richter, Operations Manager


”Impressed with the efficiency and professionalism. The entire process was smooth and hassle-free.”
- Brian Moten
”Impressed with the efficiency and professionalism. The entire process was smooth and hassle-free.”
- Joyce Gould
”Impressed with the efficiency and professionalism. The entire process was smooth and hassle-free.”
- Sharon Roddy
Customer reviews
Discover what our clients think about our service

Euro Data Solutions transformed our data analysis process. They provided innovative solutions that truly impressed us.
Tech Innovators

The professionalism and technological expertise of Euro Data Solutions boosted our data visualizations remarkably. Highly recommended!
Data Heroes

★★★★★
★★★★★
Contact Us
Get in touch for expert data analysis and transformation services.
Euro Data Solutions
Professional data analysis and transformation services.
Contact
Support
© 2025. All rights reserved.
+32 460247671