Data Solutions

Professional websites for data analysis and transformation projects.

A screen displaying a GitHub pull request page with a focus on a code snippet involving JavaScript transformations. The pull request is titled to enforce default options, and it is open. The code block shows modifications with specific lines highlighted in red and green to indicate changes.
Dashboard Design

Created interactive dashboards that enhance data visualization and insights.

A promotional banner with a bold red background features the text 'Data has a better idea' in large white letters. Above the text, the word 'HIVERY' is printed along with a stylized logo resembling a beehive. The background also includes a pattern of blue circles and dots, giving a digital or technological feel. In the surrounding area, there's a partial view of a desk and some office supplies.
BI Consulting

Provided expert consulting services in Business Intelligence and data strategies.

Data Solutions

Showcasing our expertise in data analysis and transformation projects.

Close-up view of rows of numbers and data entries displayed in a grid format, resembling a spreadsheet or data table.
A computer screen displaying an analytics dashboard with metrics such as event activity, showing a current value of 4.7k for today's activity. There are graphs indicating trends and peaks in the data, as well as labels for different types of events.
A digital dashboard displaying various analytics charts and graphs. There is a line graph showing user engagement over time on the left, a section with total revenue marked as $74K, and bar charts illustrating user statistics by region. The central section highlights users in the last 30 minutes, focusing on different countries such as the United States, Canada, India, Pakistan, and Brazil.
Two people are sitting at a wooden table, engaging in a discussion. A laptop is open, displaying a statistical dashboard with charts and a world map. Several smartphones and notepads are scattered on the table. The focus is on the person's hand gesturing in conversation, indicating active engagement.
A whiteboard with blue marker drawings and text. The left side features a series of boxes and arrows, along with handwritten labels and lines suggesting a flowchart or diagram. Text includes terms like 'docs', 'identify', and 'trainer'. The right shows an arrow pointing to a boxed section with more text entries, one including a name.
A grayscale digital abstract representation features a human-like face with a mesh overlay and various geometric patterns and data sequences. The image combines elements of a human face with grid lines and digital noise, suggesting a blend of technology and humanity. Numbers and codes are interspersed throughout, enhancing the theme of digital interaction.

Get in Touch

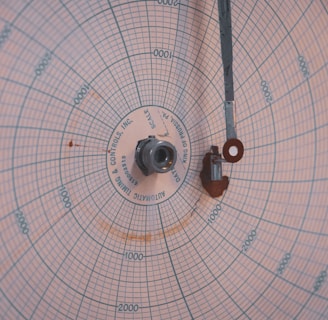
A circular chart paper with blue grid lines, marked with numerical data points and labels in a radial pattern. A central pivot with metallic components extends a thin arm across the chart. The markings indicate measurements in a systematic manner, featuring various numerical values.

Contact us for professional data analysis and transformation solutions tailored to your business needs.